
Pillar 01 · Pour Cost Economics · 6 min read
In this piece
- What two percentage points of pour cost are worth in real dollars
- What a good pour cost looks like for liquor, beer and wine
- Four reasons your pour cost report can't be trusted
- Four fixes you can start this month, no software required
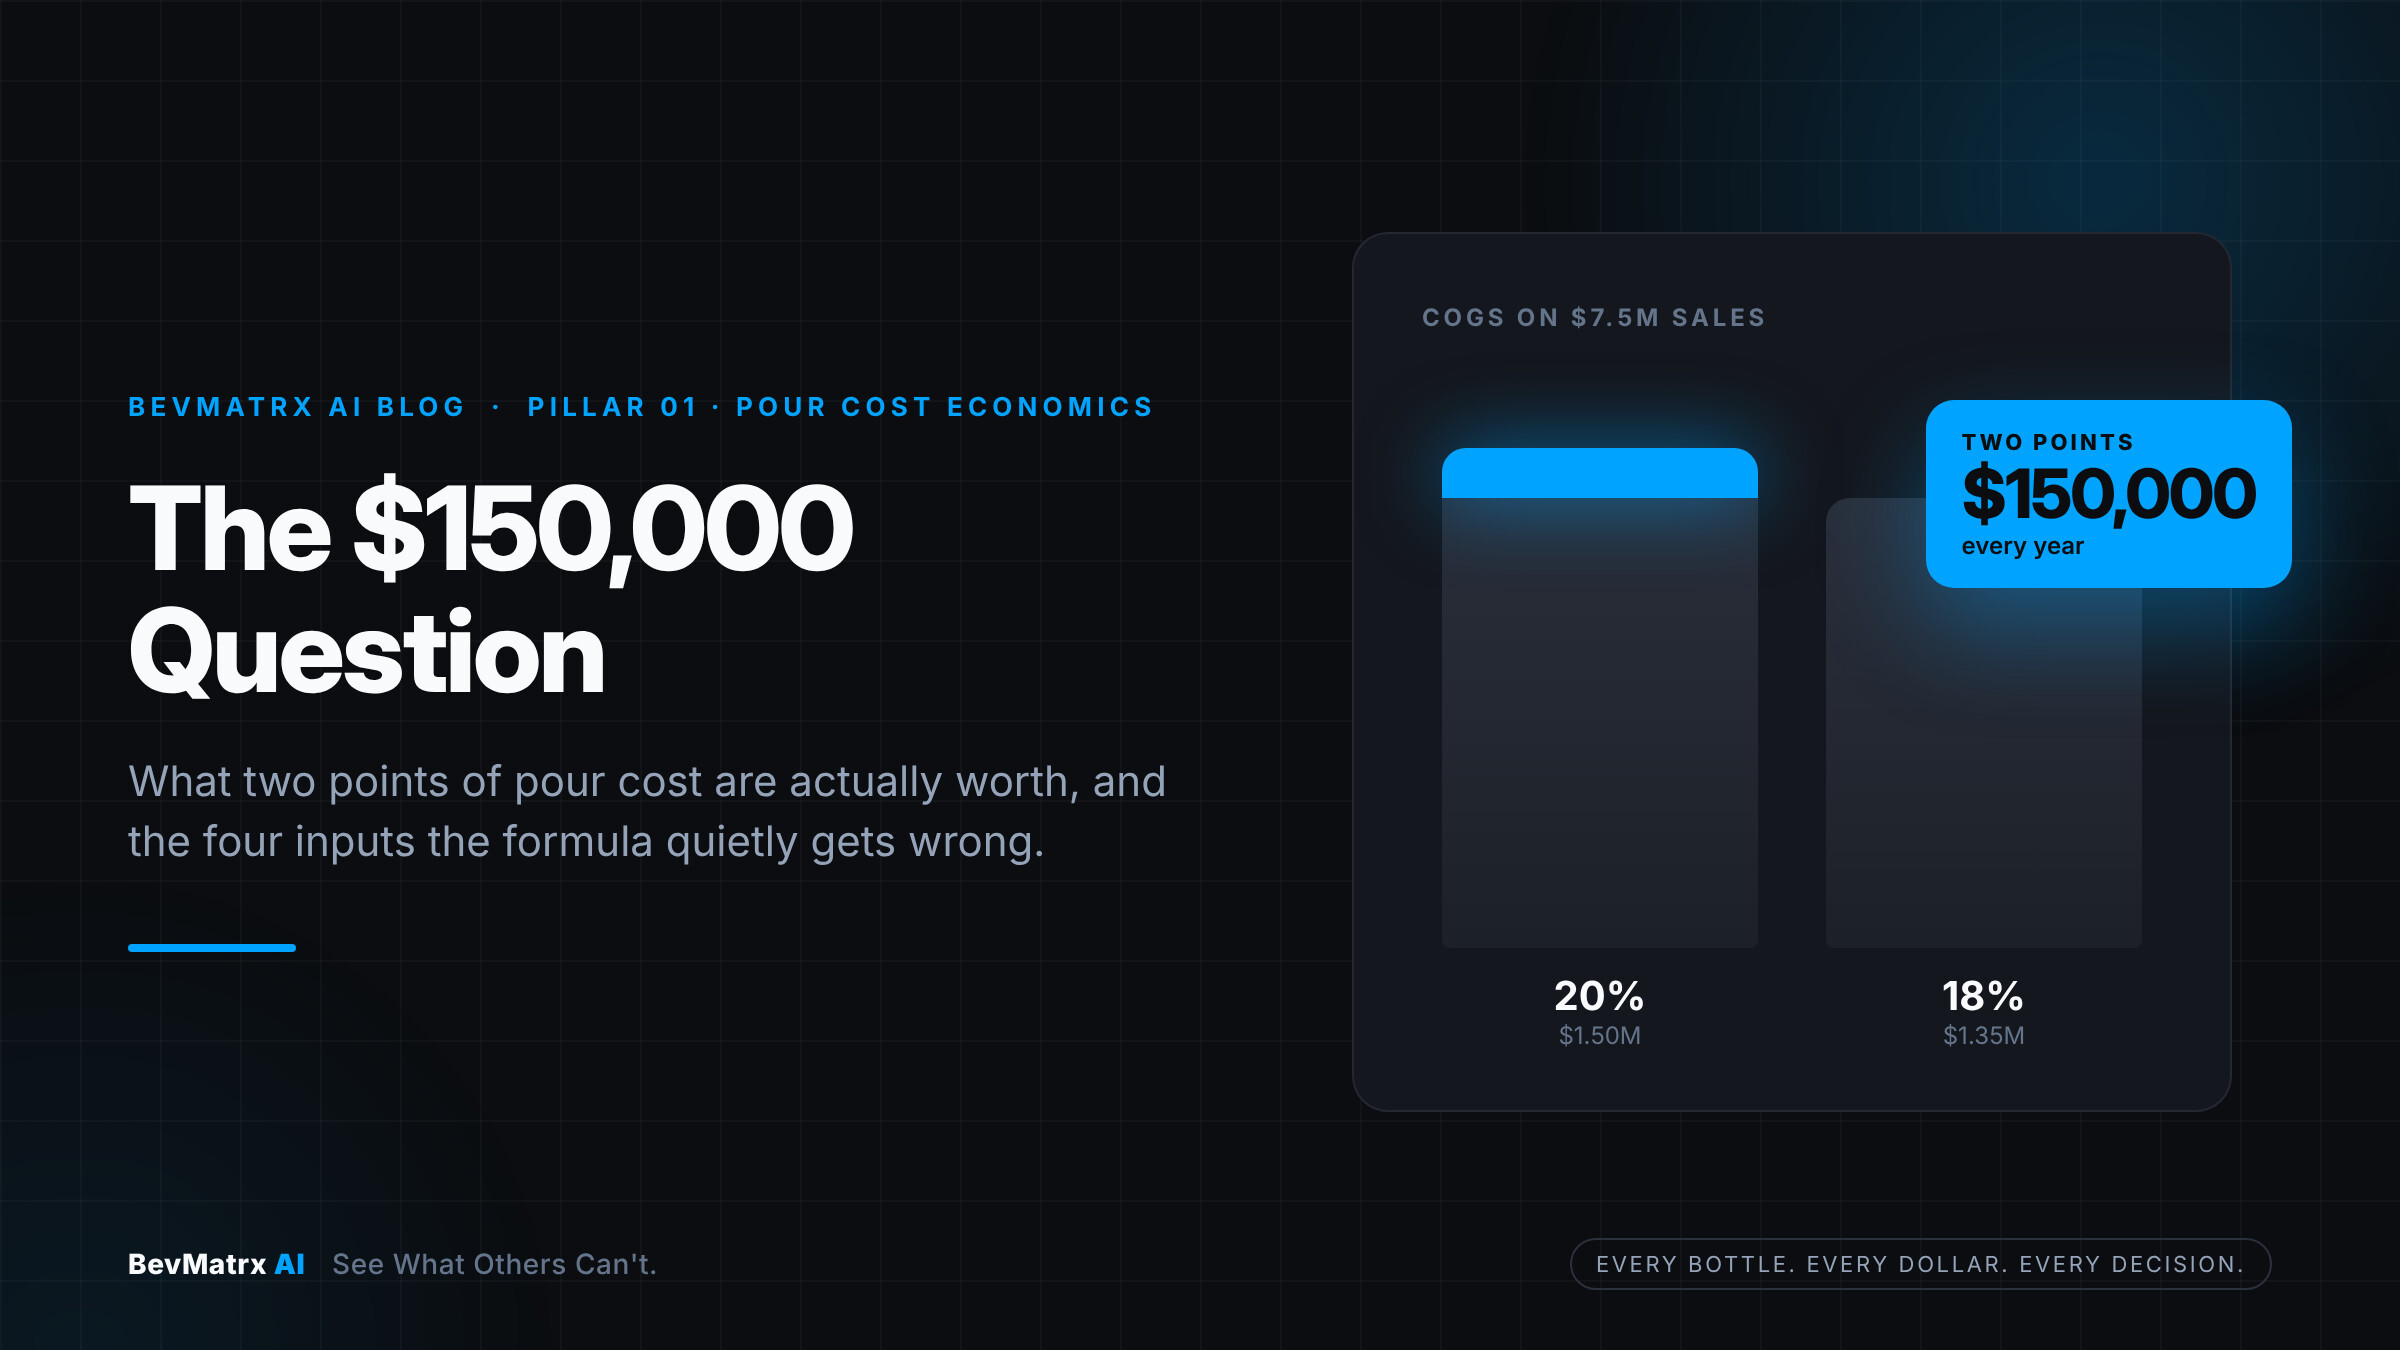
"Beverage pour cost came in at 20%. The plan said 18%."
Every budget review has some version of this moment. Someone says, "So beverage pour cost is two percentage points over plan." Someone blames the busy patio, the new bartender, the distributor's price increase. Everyone nods, and the meeting moves on.
Here is what nobody in the room says out loud: no one actually knows what caused those two percentage points. Not which venue. Not which drinks. Not whether it will happen again next month. And those two percentage points are worth a lot more money than the five minutes the meeting gave them.
What two percentage points of pour cost are actually worth
Pour cost is simple: what the drinks you sold cost you to make, as a percentage of what you sold them for. If a $10 cocktail costs $2 to make, that drink has a 20% pour cost.
Now scale it up. Picture a ten-location hospitality group doing $30 million a year in total sales. Beverage accounts for 25% of total sales, which means $7.5 million a year in beverage sales.
At that size, every one percentage point you cut from pour cost is worth $75,000 a year (1% of $7.5 million). Cutting pour cost by two percentage points, from 20% down to 18%, is worth $150,000 a year.
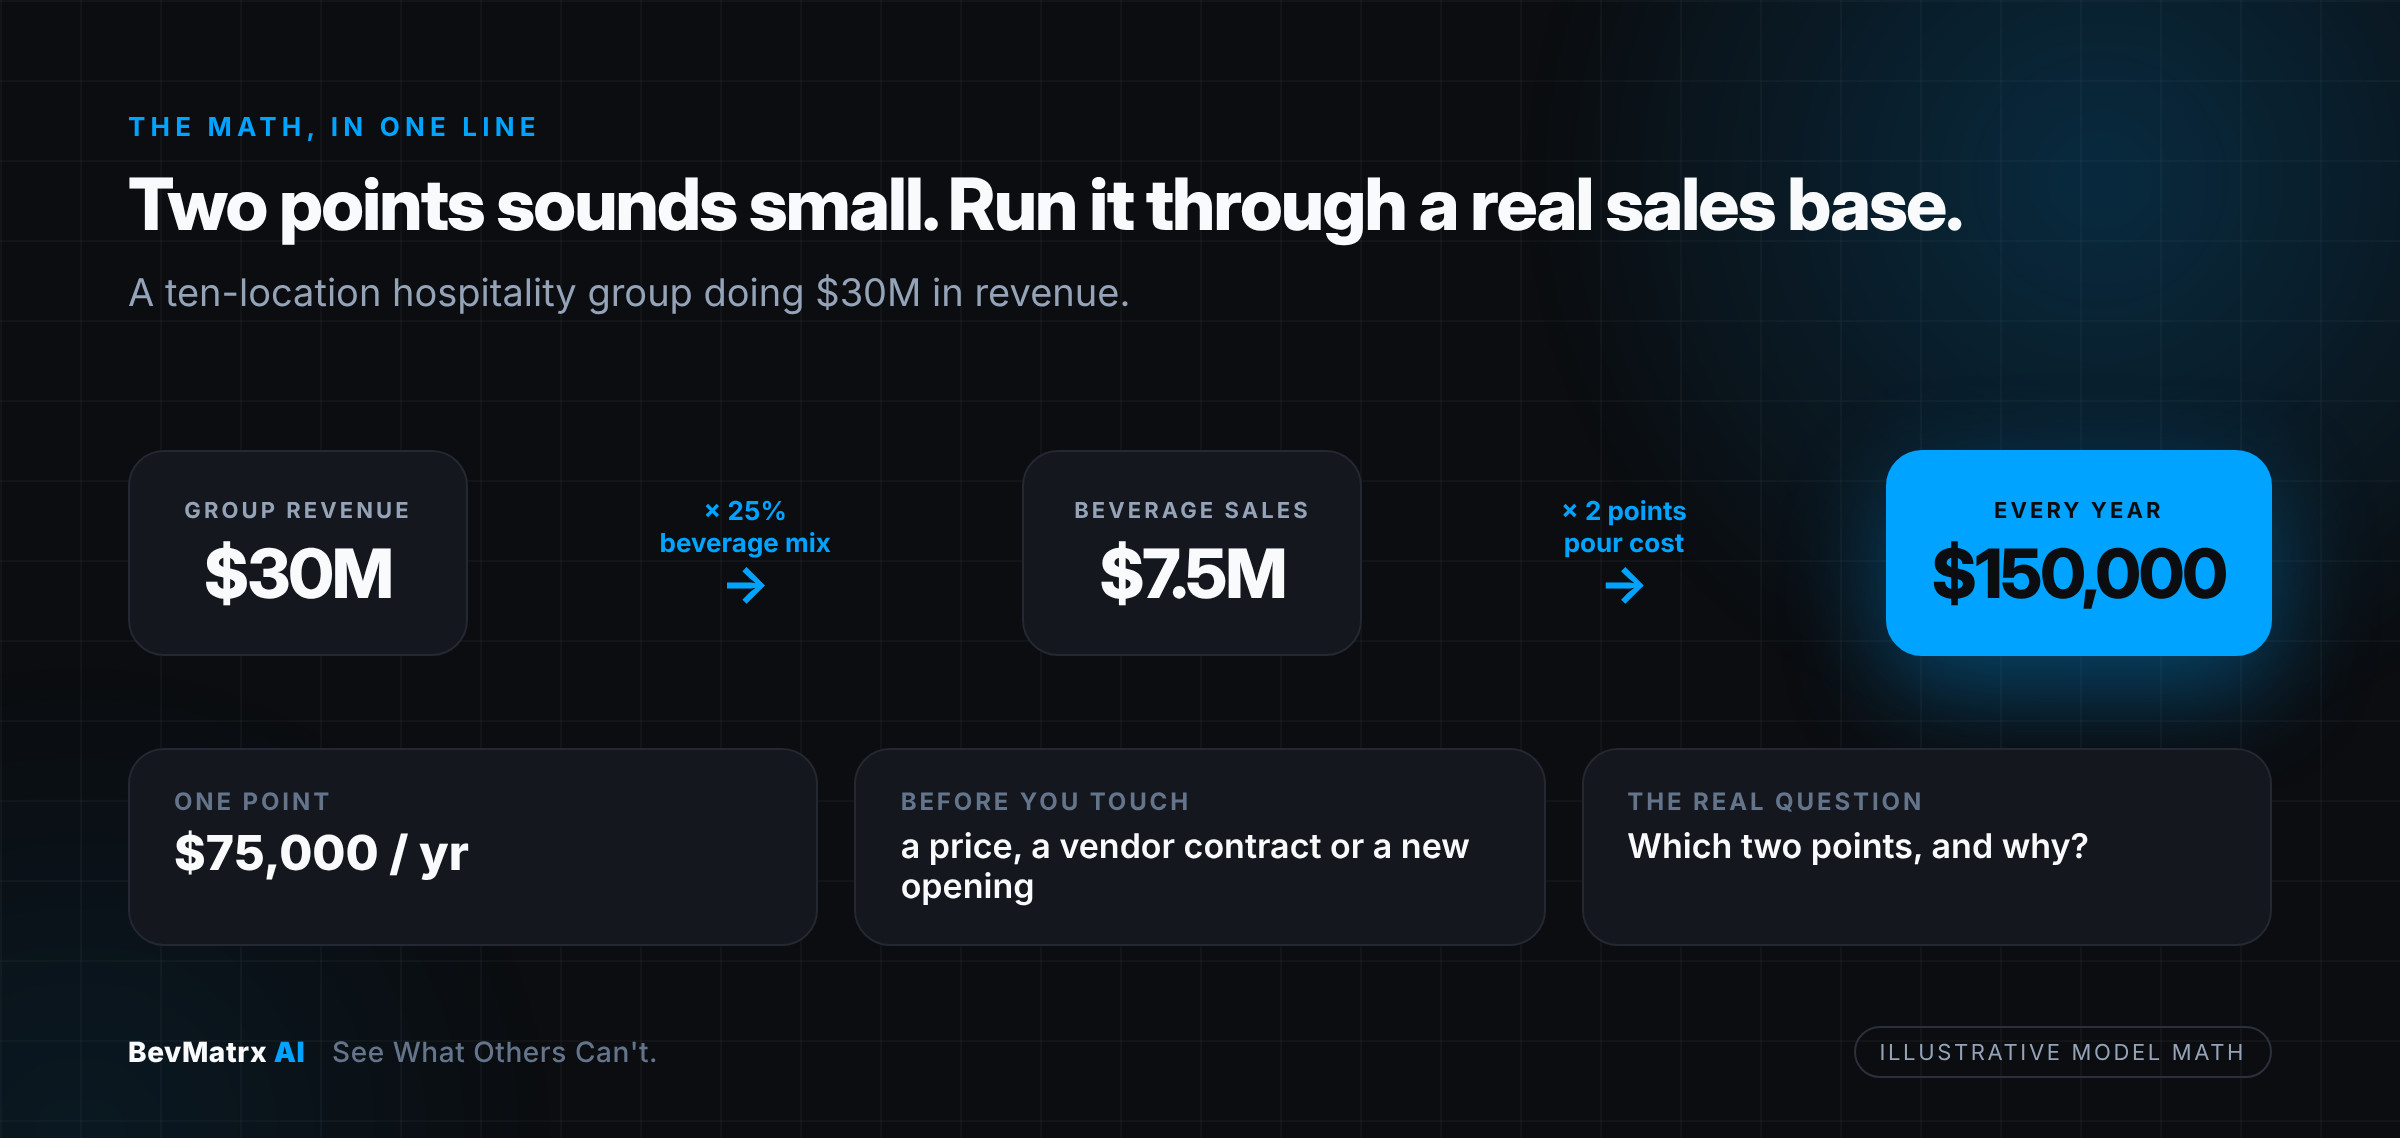
That's $150,000 every year without raising a single price, renegotiating a single vendor contract, or opening a new location. (Illustrative math. Run it on your own beverage sales.)
Most operators already sense this. What almost none of them can tell me is what caused their pour cost to go up. They know it went up. They can't say why. And a pour cost you can't explain is a pour cost you can't fix.
What a good pour cost looks like
Ask ten operators what pour cost they aim for and you'll hear the same answer: "around 20%." That isn't wrong. Well-run beverage programs usually land between about 18% and 24% pour cost overall.
But one overall pour cost for the whole beverage program hides a lot, because liquor, beer and wine each run at a very different pour cost.
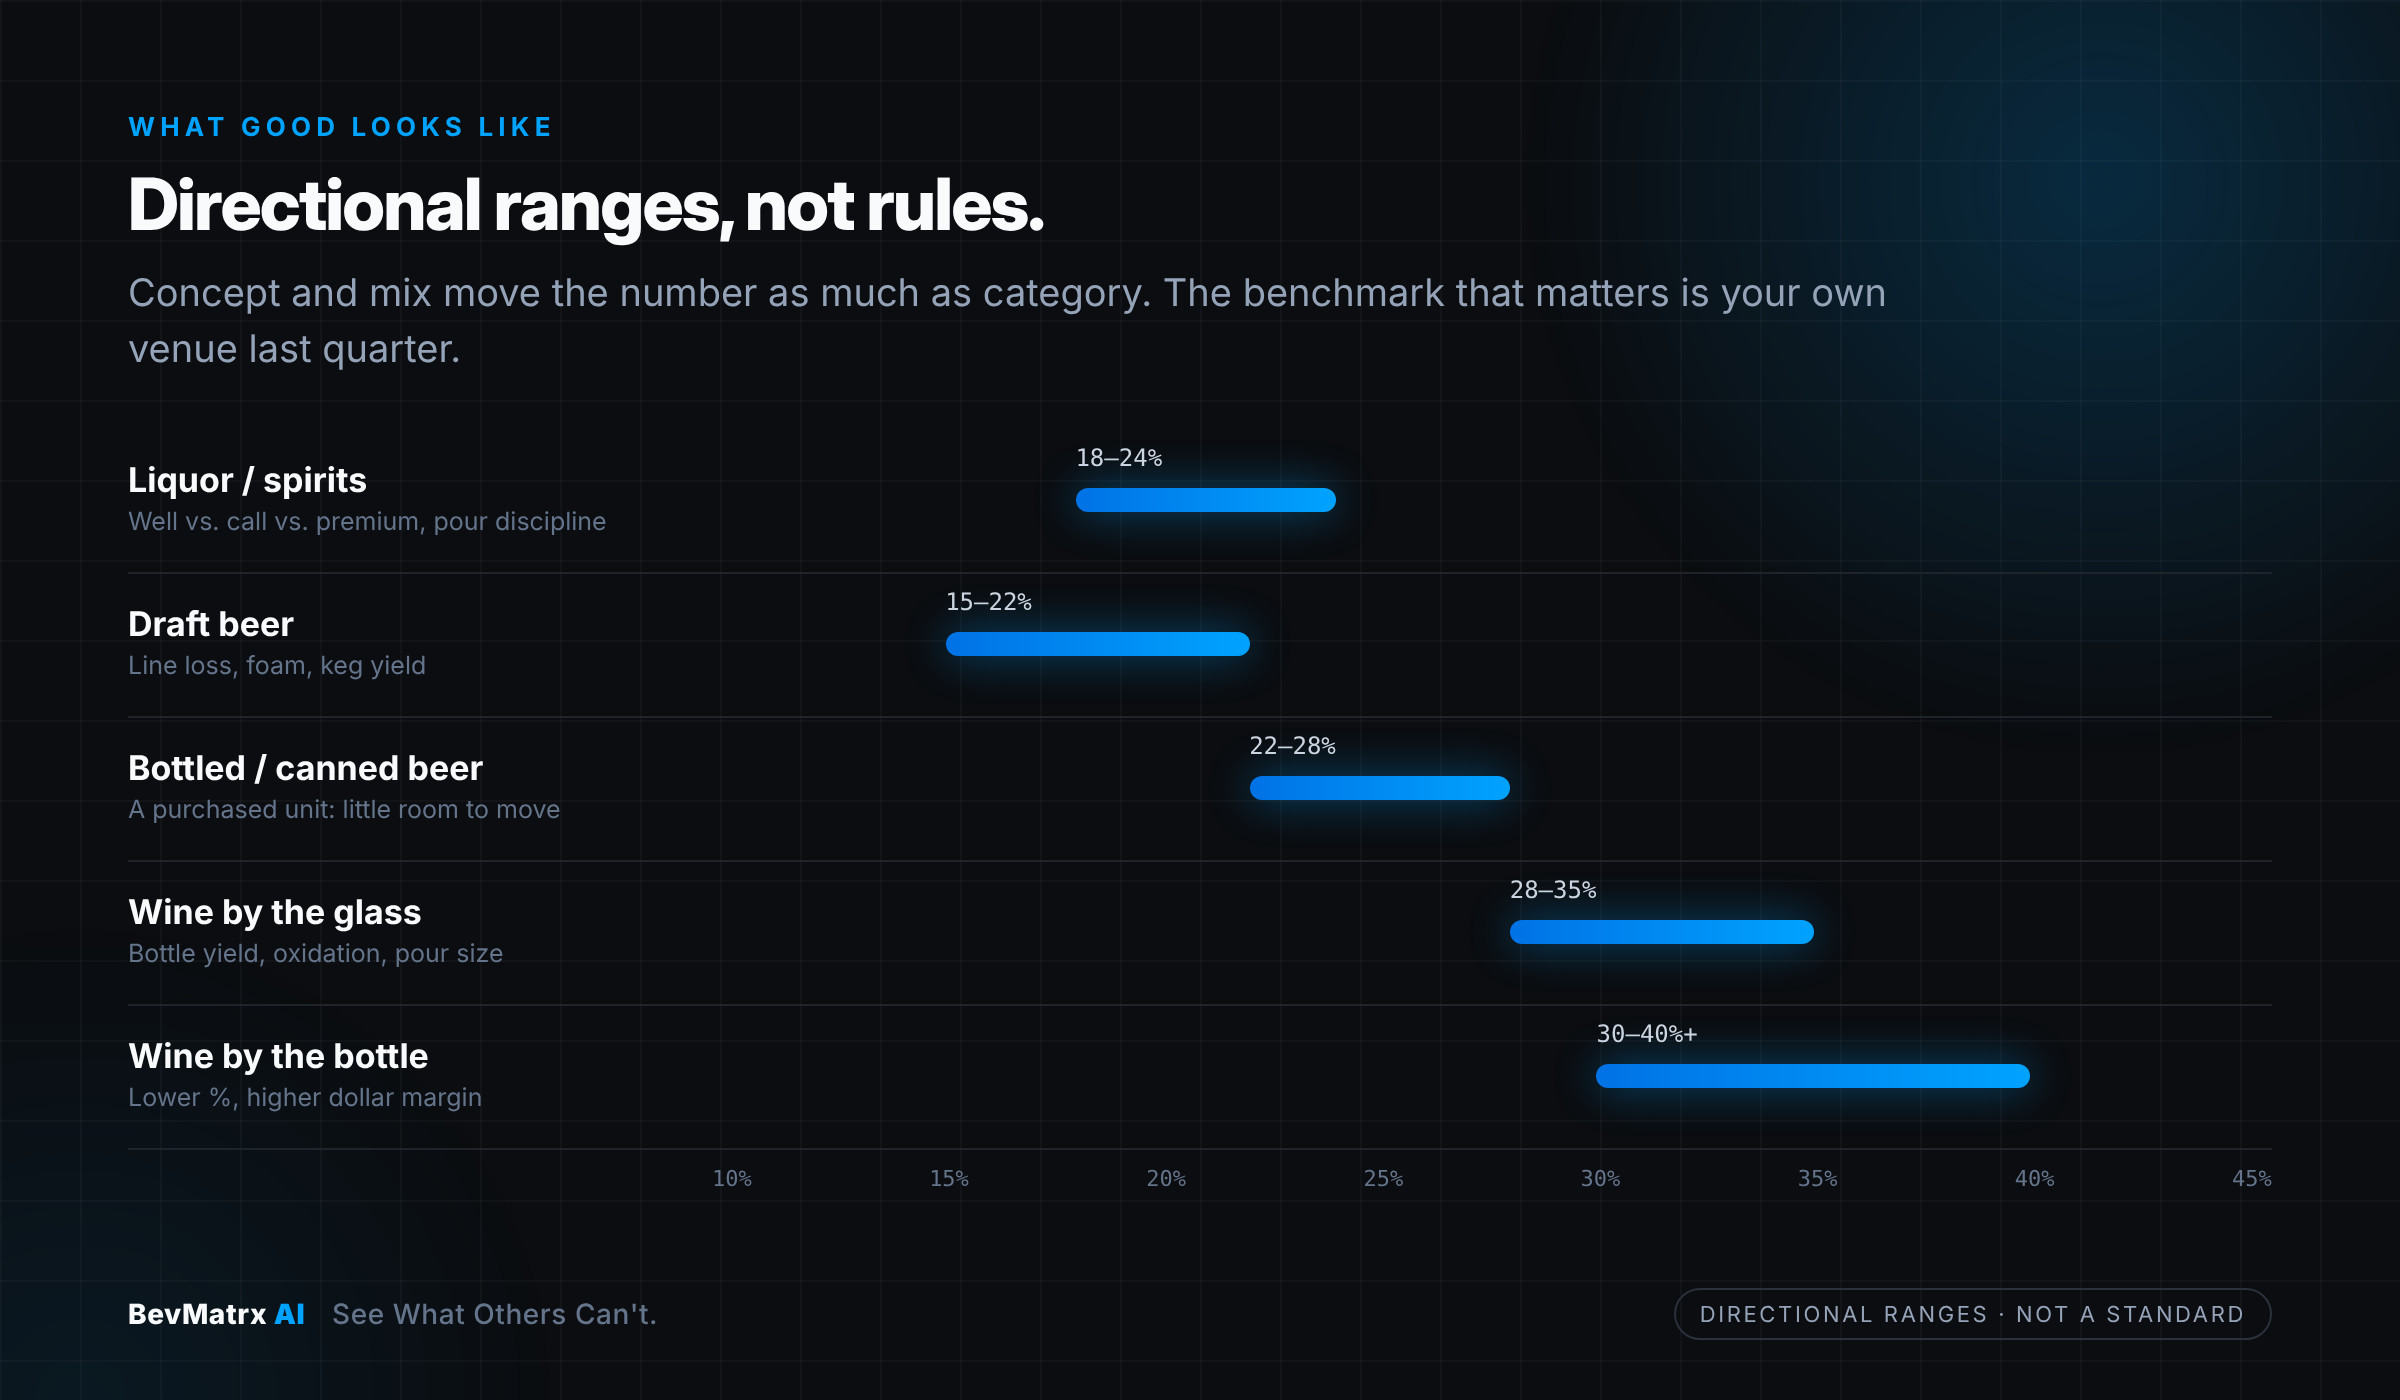
The type of venue matters just as much. A steakhouse that sells a lot of wine might run a 24% pour cost and still be outperforming a nightclub running a 19% pour cost. Both can be excellent operations.
The pour cost to compare against isn't the industry average. It's your own venue's pour cost last quarter.
The question that matters is whether each venue is hitting the pour cost target you set for that venue, and if not, why. When you try to answer why, your pour cost report starts to mislead you.
Four reasons your pour cost report can't be trusted
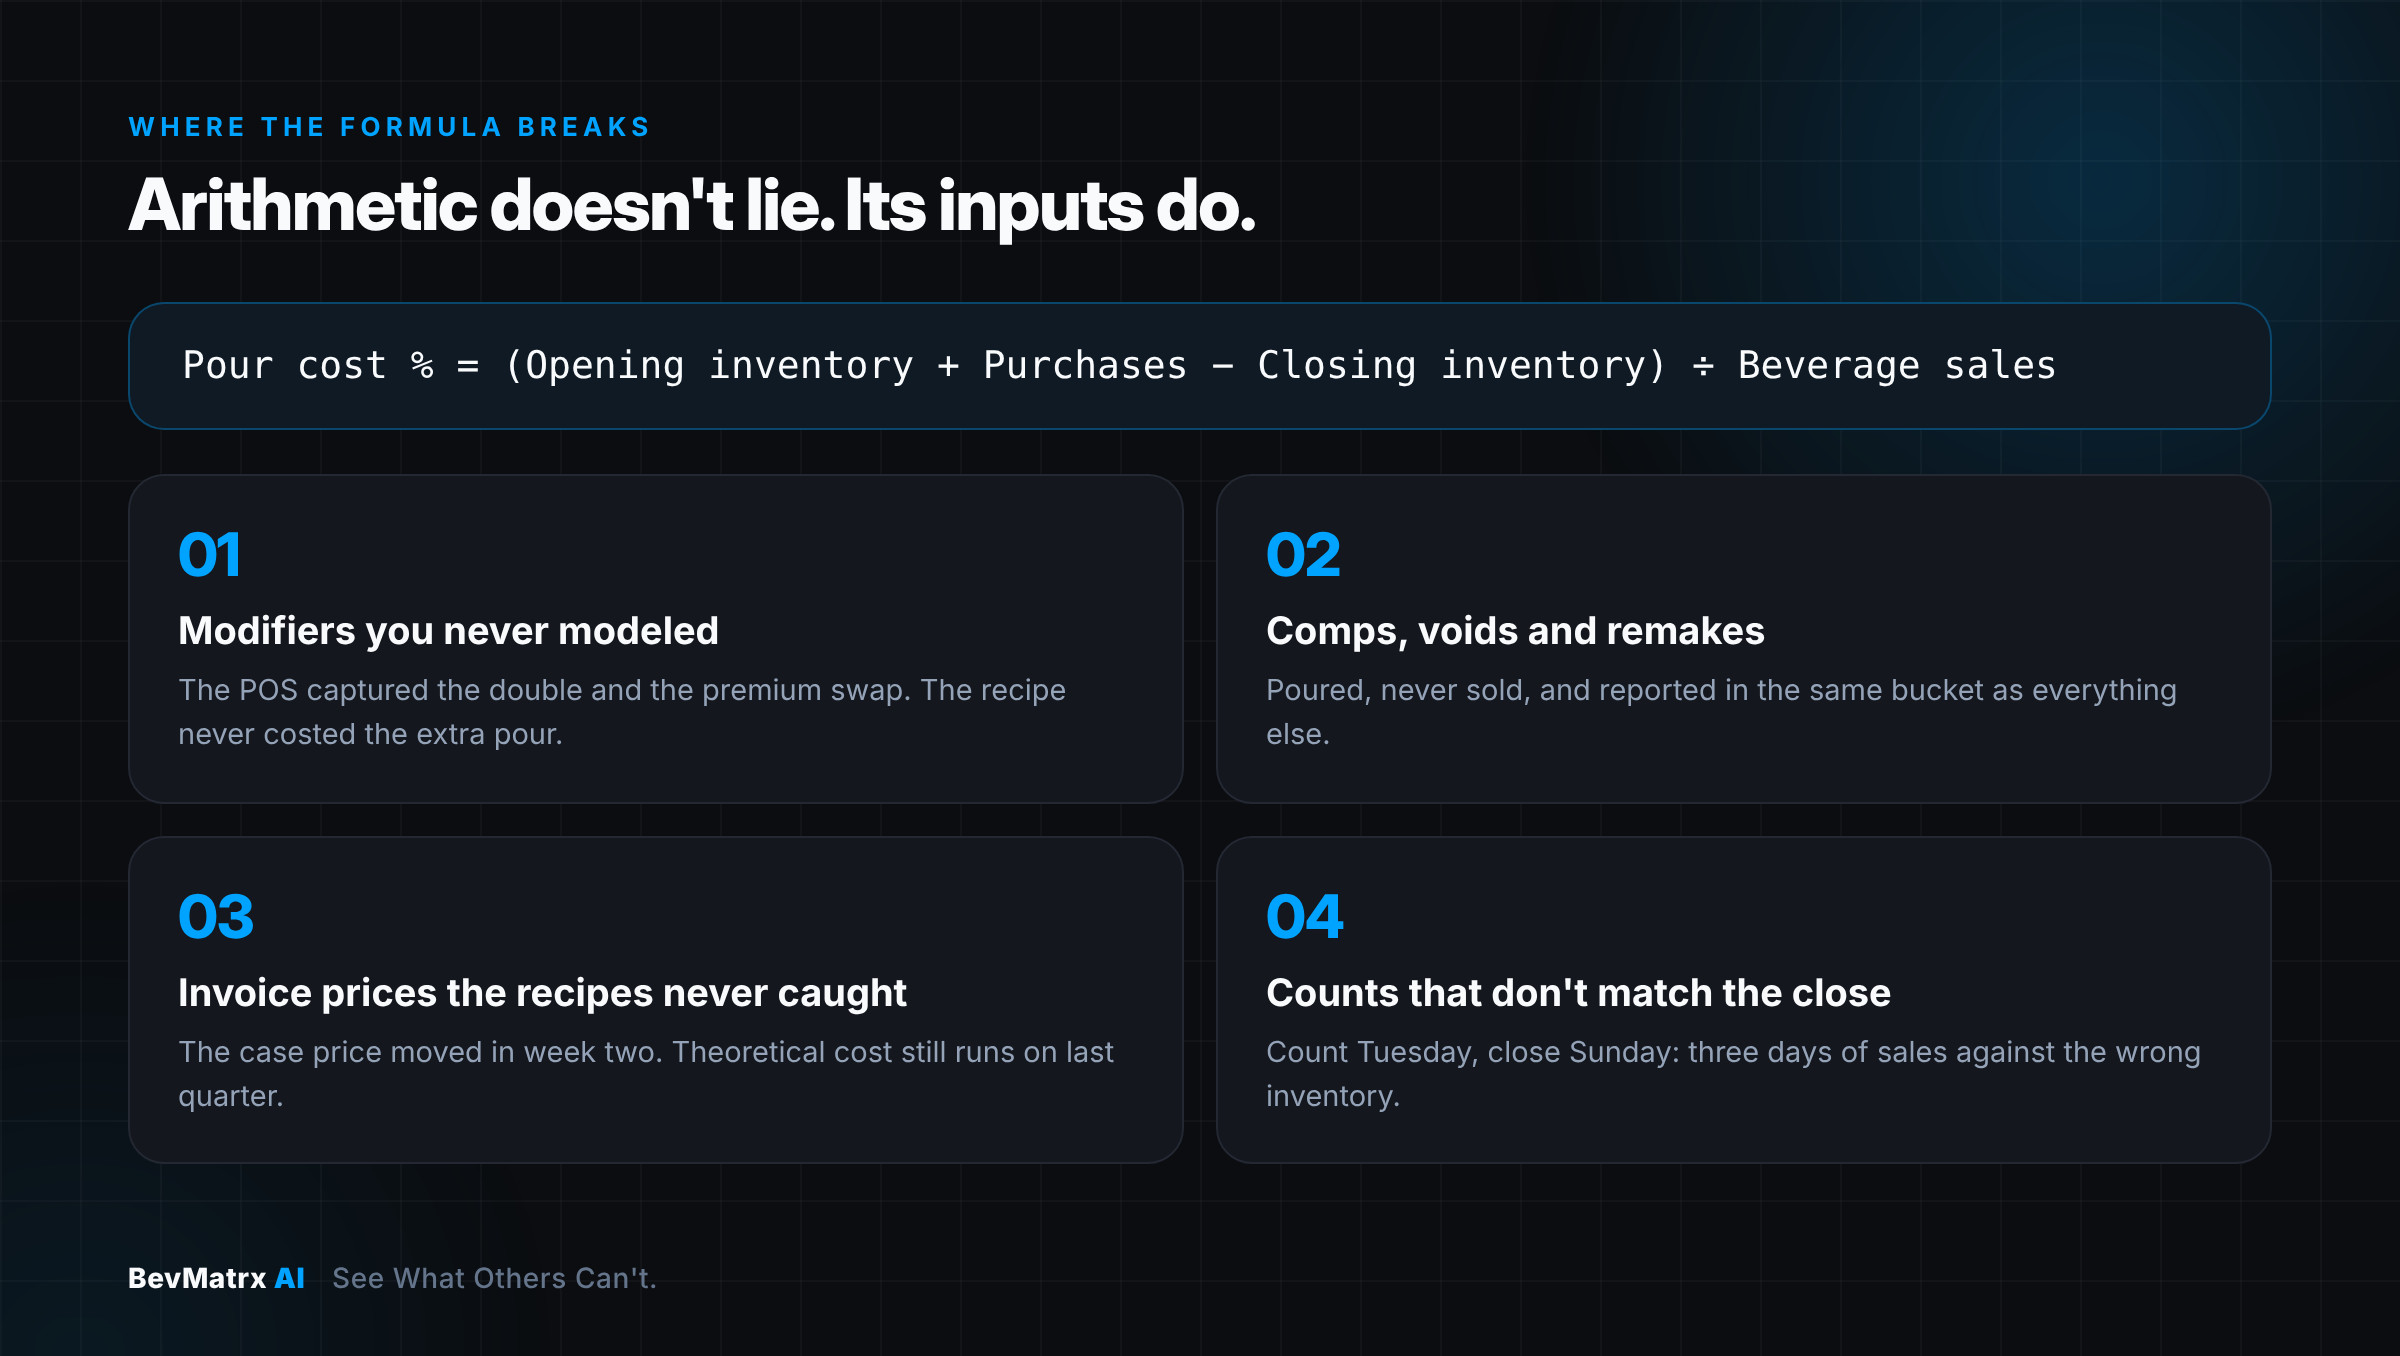
The pour cost math itself is fine. The problem is the data that goes into it. In most multi-location groups, four pieces of that data are quietly wrong.
1. Drinks that cost more than the recipe says
Your POS says you sold 180 Old Fashioneds, and your system costs every one of them off the standard recipe. But 25 of them were doubles, and 40 were made with a premium bourbon upgrade.
The guest paid for the upgrade, but the recipe never included the extra bourbon. So your pour cost report shows that bourbon as missing product, which looks exactly like over-pouring. A bartender who did nothing wrong gets blamed.
2. Comps that show up as missing product
When a manager comps a round for a regular, that's a smart, deliberate business decision. But the drinks were still poured. If the comp isn't rung in properly, the product looks like it simply went missing, and nobody can tell a legitimate comp apart from real loss. Remakes work the same way: poured twice, sold once.
Voids are different. A void means the drink was never made, so no product left the bottle and it shouldn't affect pour cost at all. Comps and remakes are where the cost hides.
In my co-founder JP's experience running beverage across more than forty locations, the comp button is the least-audited thing in the entire operation. Not because anyone is doing something wrong, but because nobody has ever shown the person pressing it what their comps cost in a year.
3. Price increases your recipes missed
Your distributor raises the price of your well tequila mid-month. You pay the new price, but your recipe costs still use the old one.
Pour cost goes up, and everyone starts looking behind the bar. The real answer is sitting on an invoice. Across hundreds of drinks and a dozen suppliers, these small price changes can add a full percentage point to pour cost faster than anyone expects.
4. Inventory counts that don't line up with the sales period
Pour cost compares what you spent on product during a period to what you sold during that same period. If your sales period ends Sunday night but you don't count inventory until Tuesday morning, two extra days of drinks have left the bottle that your sales total doesn't include. Your pour cost is wrong before anyone looks at it.
Deliveries cause the same problem. If a big Friday delivery is recorded as a purchase but missed in the inventory count, this month's pour cost looks too high and next month's looks too low. Operators call this "the numbers bouncing around." Nothing changed behind the bar. The timing of the count did.
Why the monthly pour cost meeting never changes anything
Put those four together and you get a meeting every multi-unit operator knows. The pour cost report is three weeks old. It's wrong by an amount nobody knows. Nobody can say what caused it, so the only advice left is "watch your pours" and "check your ordering."
Everyone agrees to do better. Nothing changes. Next month, it happens again.
One overall pour cost tells you the temperature of the building. It doesn't tell you which room is on fire.
Where to start this month
Four fixes, in order. None of them need new software.
1 · Count inventory on the same day the sales period ends. Do it the same way at every venue. If the count and the sales period don't match, nothing else in your pour cost can be trusted.
2 · Add your upcharges to your recipes. Find your ten most common doubles, premium upgrades and size upgrades, and put their real cost into the recipes.
3 · Put a dollar figure on comps and share it with the managers giving them. Not as an accusation, as information. Most comp habits correct themselves once a manager sees what their comps cost in a year.
4 · Update the cost of your top twenty drinks using this month's invoices. Twenty drinks usually make up most of what you sell. One missed price increase can raise pour cost for a whole category, like tequila.
Do those four, and your pour cost becomes a number you can hold people to. Not because it got better, but because it finally reflects what's actually happening behind the bar.
Which of the four is hiding in your pour cost? We've sat in a lot of these meetings. Tell us what your last one looked like and we'll tell you where we'd look first.
Once you know what caused them
Two percentage points of pour cost turn into three wins
01
More revenue
From smarter sales.
02
Lower costs
Buy what sells, not what the spreadsheet says.
03
A more profitable operation
Every venue, every week.
Frequently asked questions
What is a good pour cost percentage for a bar?
Well-run beverage programs generally run between about 18% and 24% pour cost overall, depending on what they sell and the type of venue. Liquor typically runs an 18–24% pour cost, draft beer 15–22%, and wine by the glass 28–35%. The most useful target is one you set for each venue and track over time.
How do you calculate pour cost?
Pour cost % = (cost of beverages sold ÷ beverage sales) × 100. Cost of beverages sold = opening inventory + purchases − closing inventory. For example, if you start the month with $40,000 of product, buy $52,000 more, end with $38,000 on hand, and bring in $270,000 in beverage sales, your cost of beverages sold is $54,000 and your pour cost is 20%.
Why is my pour cost different every month?
Usually because of timing, not anything changing behind the bar. Inventory counts that don't line up with the sales period, deliveries that weren't counted, and price increases your recipes missed all make pour cost swing up and down.
What is the difference between pour cost and liquor cost?
They're often used interchangeably. Pour cost usually covers all beverages (liquor, beer and wine) as a percentage of beverage sales, while liquor cost covers spirits only. Be clear which one you're reporting, because comparing one venue's liquor cost to another venue's overall pour cost will mislead you.
How much is one percentage point of pour cost worth?
One percentage point of pour cost equals 1% of your annual beverage sales. For a group with $7.5 million in beverage sales, cutting pour cost by one percentage point is worth $75,000 a year.
Find your two percentage points
See what one percentage point of pour cost is worth in your group.
Tell us how many locations you run and your annual beverage sales, and a founder will walk you through what cutting pour cost by one, two or three percentage points is worth to you, and where those dollars usually hide. One location is free to start.
The Pour Report
One honest beverage number a month.
A monthly note from the founders: one finding from the field and practices you can use. Third Thursday of every month.
Brendan Carroll is Co-Founder & CEO of BevMatrx AI, the beverage intelligence platform for multi-location hospitality groups. Figures are illustrative; BevMatrx does not publish customer results without a signed case study.
See What Others Can't.
Every Bottle. Every Dollar. Every Decision.